
Predible Health
ECG Intervals
At the time of my intership, Predible was approached by a leading healthcare BPO to explore whether the annotation of raw ECGs could be annotated. Each heartbeat in an ECG signal typically consists of distinct waves - PQRST - that correspond to activations of different parts of the heart. The relative lengths of these intervals are the first set of features that cardiologists look at to diagnose various physiological conditions. For example, a prolonged QT interval can potentially cause fast, chaotic heartbeats. These rapid heartbeats might trigger a sudden fainting spell or seizure, and in some cases fatal.

The problem
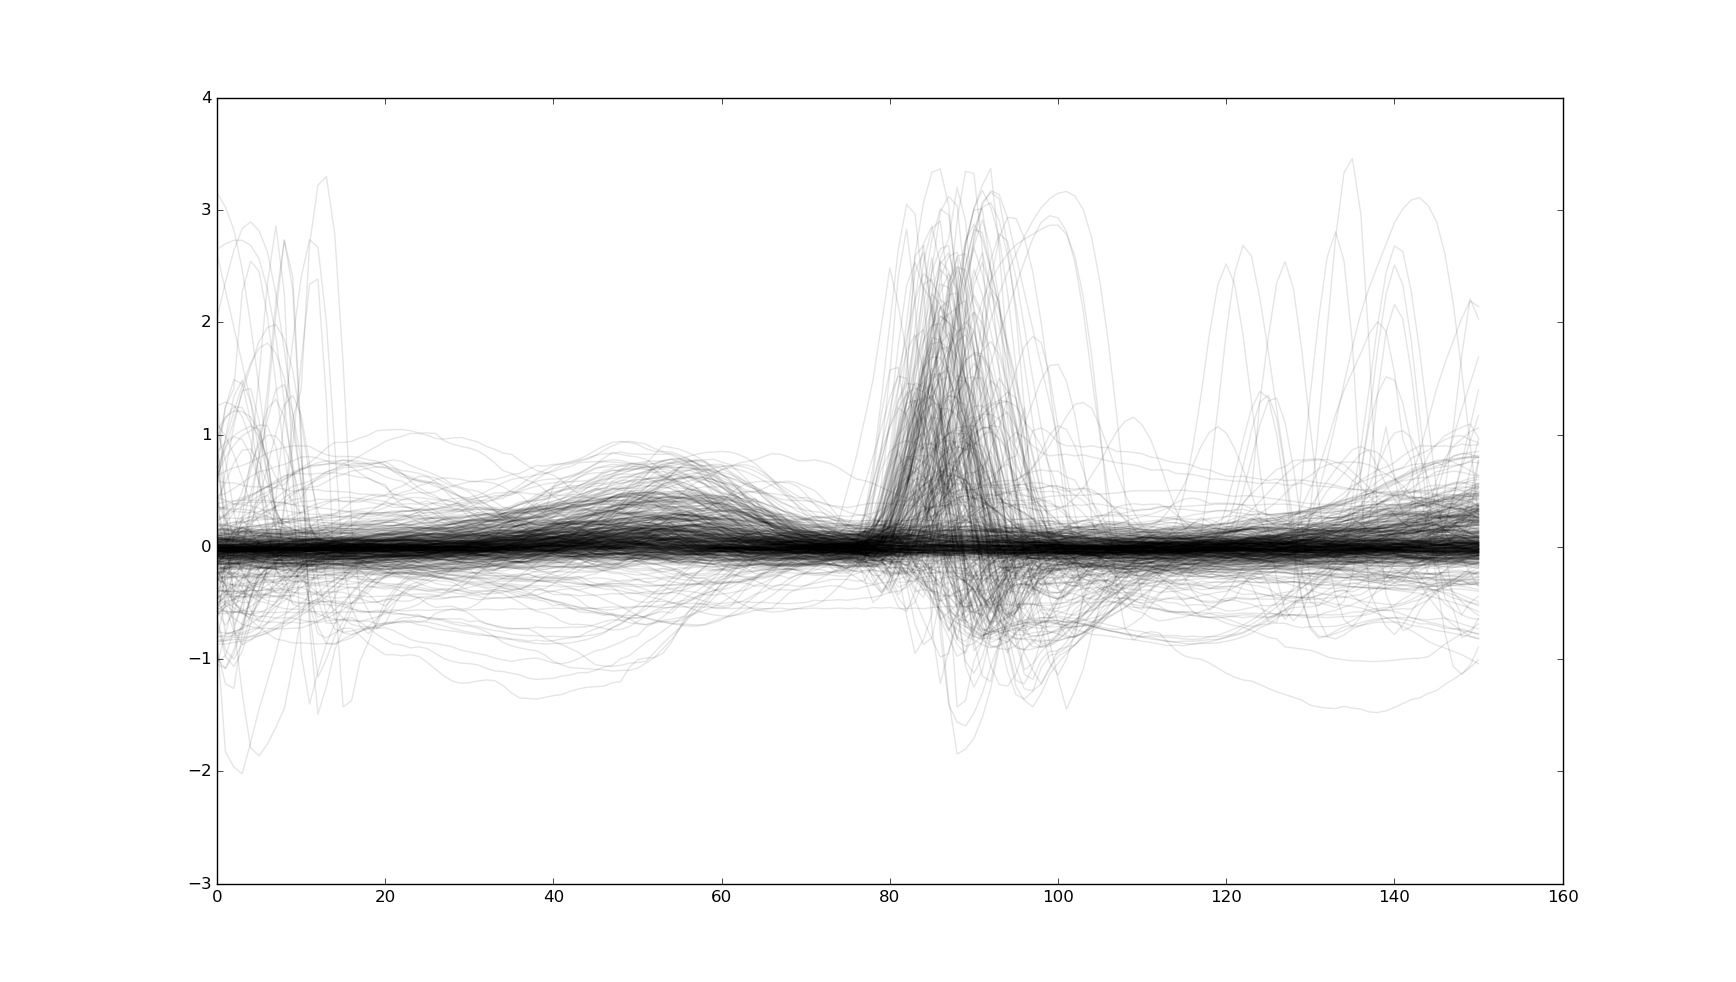
The large amount of variations in morphology and signal quality had made this a process difficult to accurately automate. This meant that large volumes of these readings were annotated by cardiologists. Starting with QT intervals specifically, I worked on building a proof-of-concept to see how well we could use deep learning, specifically ConvNets with 1-D convolutions to automate this. Using an open dataset from Physionet, I tried a few different model architectures and learning parameters in Torch. A sample of various ECG wave morphologies can be seen below.
Results
We were pleasantly surprised to see that we were able to achieve a performance accuracy that was comparable to the variation between baseline expert annotations on the dataset!